
Devtools & Tracing
HyperDB can record a trace of every selector run and action, and ships an
in-app devtool to browse those traces. The devtool shows the same execution path
your code describes: nested selectors/actions, indexed reads, row counts,
mutations, timings, and whether HybridDB served reads from memory or the
primary store.
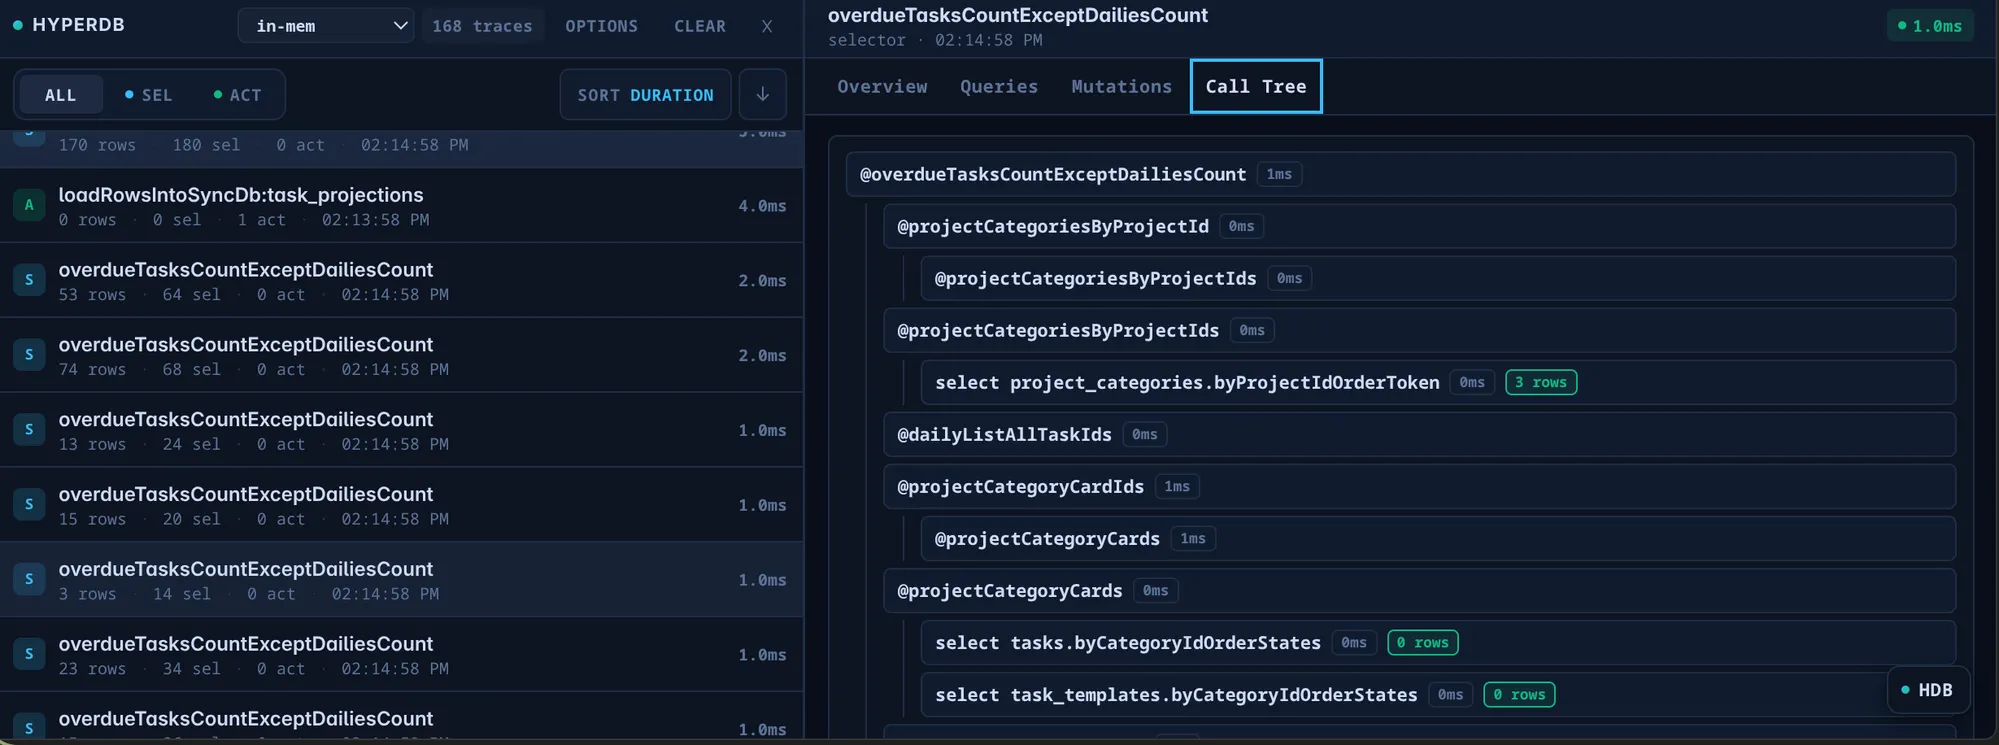
The devtool panel
Section titled “The devtool panel”The devtool is exported from @will-be-done/hyperdb-devtool/react. Render
HyperDBDevtools anywhere in your tree; it can read the database from
DBProvider context, or take an explicit db prop.
import { DBProvider } from "@will-be-done/hyperdb/react";import { HyperDBDevtools } from "@will-be-done/hyperdb-devtool/react";import { db } from "./db";
export function App() {  return (    <DBProvider value={db}>      <YourApp />      <HyperDBDevtools db={db} initialIsOpen={false} />    </DBProvider>  );}
HyperDBDevtools props
Section titled “HyperDBDevtools props”| Prop | Description |
|---|---|
db | The SubscribableDB to inspect (defaults to context) |
initialIsOpen | Whether the panel starts open (persisted in localStorage) |
position | "top" | "bottom" | "left" | "right" |
buttonPosition | Corner for the toggle button |
maxTraces | Maximum number of traces to retain |
theme | "dark" | "light" | "system" |
There is also HyperDBDevtoolsPanel for embedding the panel directly (without
the floating toggle), with an embedded flag and an onClose callback.
Tracing
Section titled “Tracing”Each selector and action run produces a root trace. Open one to see:
- the selector/action call tree, including composed selectors and actions;
- every indexed read, with the table, index, row count, and timing;
- mutations performed by actions;
- cached selector hits, so you can tell when a selector result was reused instead of recomputed;
HybridDBread source labels:in-memfor the memory cache,persistfor the primary store.
The trace list can be sorted by creation time, duration, or rows fetched. The rows fetched sort uses the total rows returned by all select events in a trace, which makes broad scans and high-fanout selectors easier to spot.
Trace rows are tagged with an in-mem badge when no select fell through to a
primary-store scan; every read in that trace was served from the HybridDB
memory cache. Mutations do not remove the badge, because HybridDB flushes writes
to the primary store separately from read tracing.
The details pane keeps the active tab while you move between traces, so you can compare Overview, Queries, Mutations, or Call Tree output without reselecting the same tab each time.
When a selector reads through HybridDB, select nodes in the call tree also show
where the returned rows came from. This is useful when tuning a local-first
screen: if a route should be warm but still shows persist, you know that
HybridDB missed the memory cache and loaded the missing range from the primary
store.
What to look for
Section titled “What to look for”- Unexpected broad scans. A trace with many fetched rows often means a selector is using the wrong index, missing a bound, or doing work that should be expressed as a narrower indexed read.
- Unexpected
persistreads. In aHybridDBapp, apersistlabel means the requested index range was not fully cached. That may be fine on first load, or it may point to a workflow that should preload a table or warm a known selector path. - Noisy recomputation. If a selector re-runs after unrelated mutations, check the ranges it scanned. Broad ranges naturally overlap more writes.
- Nested work. Composed selectors and actions appear as child frames, so you can see whether time is spent in the root command or in a helper it called.
Per-DB tracer
Section titled “Per-DB tracer”Set a tracer when constructing a DB. Pass the shared store, the
string "default", or "disabled".
import { DB, hyperDBTraceStore } from "@will-be-done/hyperdb";
const db = new DB(driver, { tracer: hyperDBTraceStore });
Global default tracer
Section titled “Global default tracer”To enable tracing for all databases that don’t specify their own, set the global default:
import {  setDefaultHyperDBTracer,  hyperDBTraceStore,} from "@will-be-done/hyperdb/tracing";
setDefaultHyperDBTracer(hyperDBTraceStore);
Trace options
Section titled “Trace options”Selector and action factories accept a trace option ({ enabled, startOn }):
import { createSelector } from "@will-be-done/hyperdb";
const selector = createSelector({ trace: { enabled: true, startOn: "devtoolOpen" },});| Field | Values | Meaning |
|---|---|---|
enabled | boolean (default true) | Whether this factory’s commands are traced |
startOn | "devtoolOpen" (default) | "load" | When to begin collecting traces |
startOn: "devtoolOpen" keeps overhead near zero until you actually open the
devtool; "load" traces from startup.
Skipping traces per command
Section titled “Skipping traces per command”Individual selectors and actions can opt out with skipTrace:
selector({ name: "hotPathSelector", args: {}, skipTrace: true, // or { rootTrace: boolean, childTrace: boolean } handler: function* () { /* ... */ },});Use skipTrace on extremely hot paths where even tracing metadata is measurable,
or to keep noisy internal selectors out of the devtool.